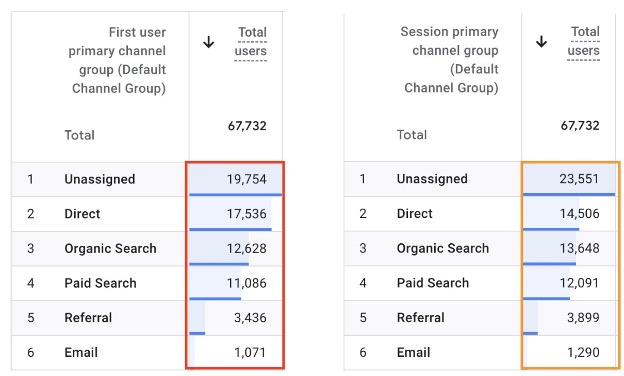
Whenever I work on a new client's Google Analytics (GA) property, I often see a few custom dimensions created. This is good because it means the company is tracking custom first-party data and it has the IT infrastructure to support the custom data output.
However, more often than not, I see little to no custom metrics created. This tells me that custom metrics are often misunderstood and overlooked, and that most companies are not taking advantage of this powerful feature to improve their GA reporting process.
In this article, I will explain:
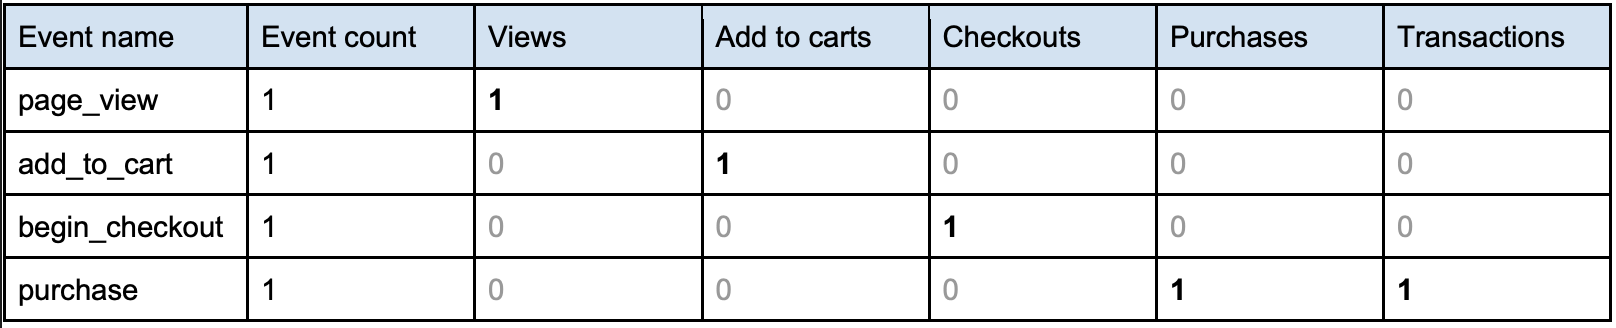
Let's use a simple user flow example:
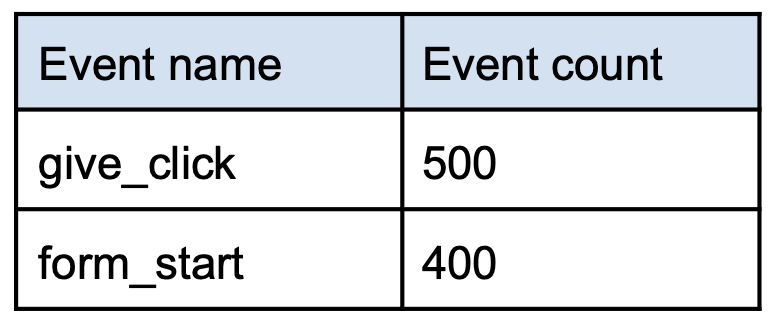
And you are record separate GA events:
Or the same event name with a supporting dimension:
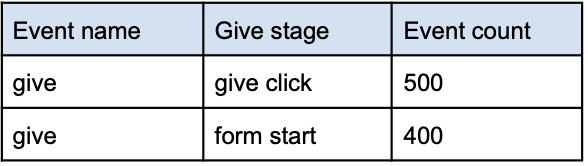
Now, if a team asks you to do a report showing the completion rate of:
give_click to form_start
You will realize that you cannot do this easily in GA. Because the data consists of multiple rows, realistically you would have to do this in multi steps. For example:
As you can see, this process isn't seamless. And it can get even more tedious if you have to do it over a longer period of time eg. A time series chart by days.
During measurement, what you want to record will look something like this:
JavaScript
dataLayer.push({
 event: "track_event",
 event_name: "give_click",
 give_clicks: 1 // Add this new parameter
});
JavaScript
dataLayer.push({
 event: "track_event",
 event_name: "form_start",
 form_starts: 1 // Add this new parameter
});
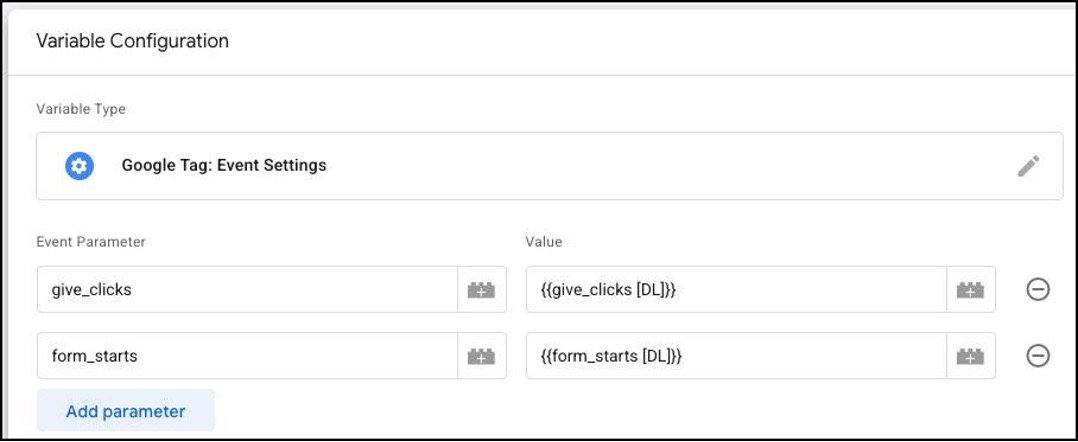
On the website, this is typically done using Google Tag Manager (GTM), so you need to map: dataLayer variables → GA event parameters
For example, you can do it in a Event Settings variable like:
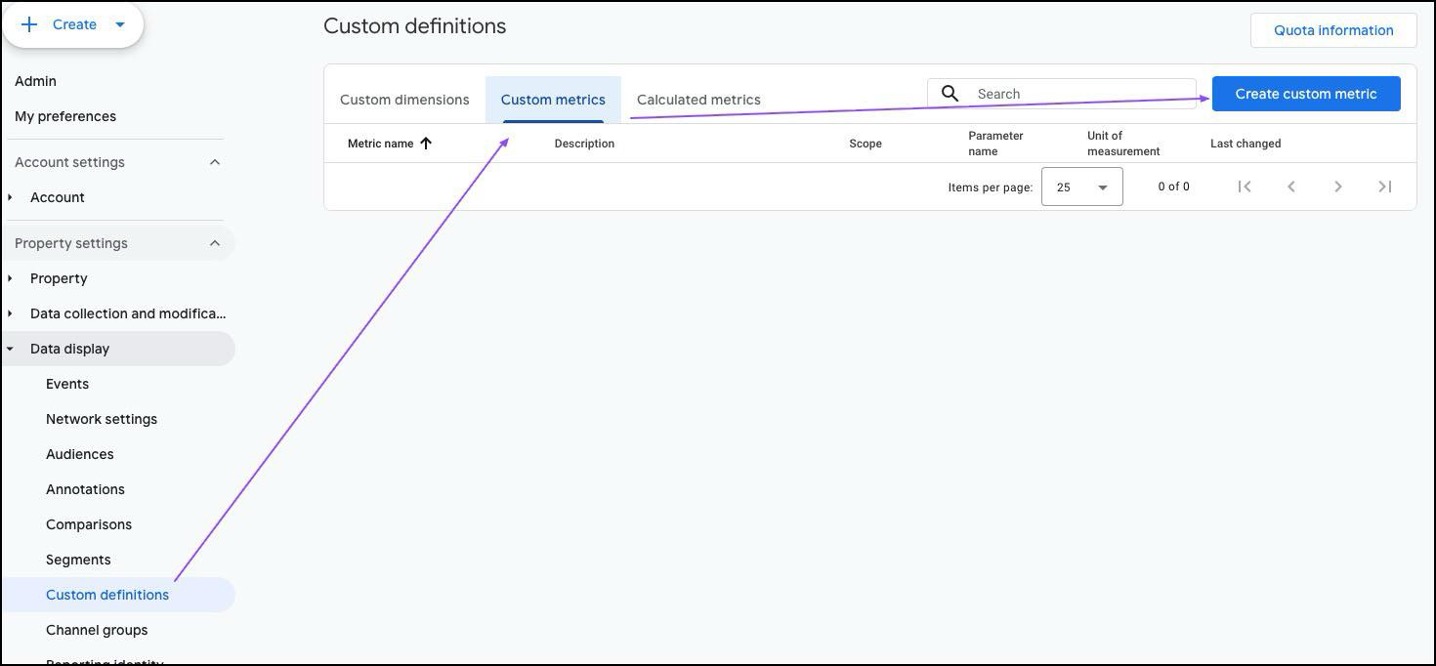
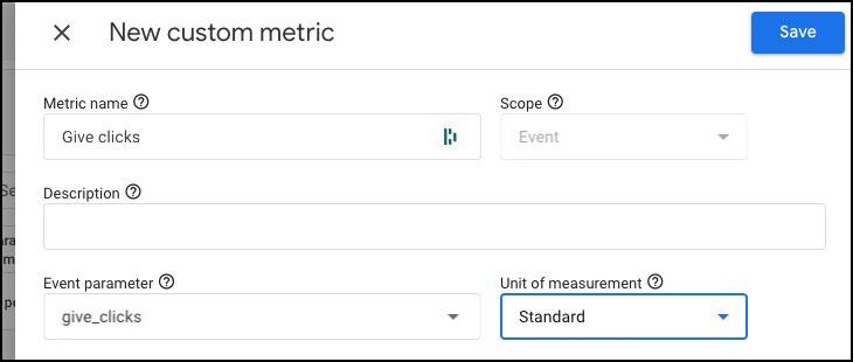
Follow this example for each of the custom metric that you want to create:
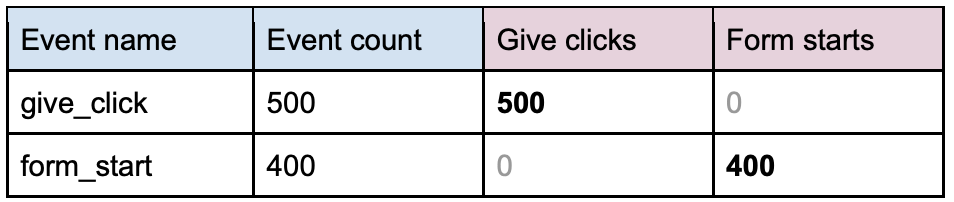
With the data recorded like this:
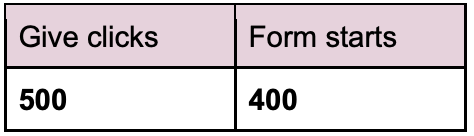
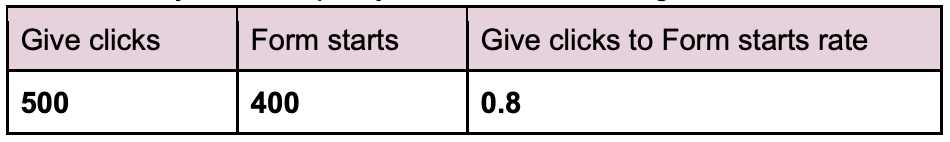
You can start to see the advantage. With dedicated custom metrics, you can refer to the metrics directly without having to filter the data (eg. Event name = give_click). For example, if you have a GA report using only these two custom metrics, you would get something like this:
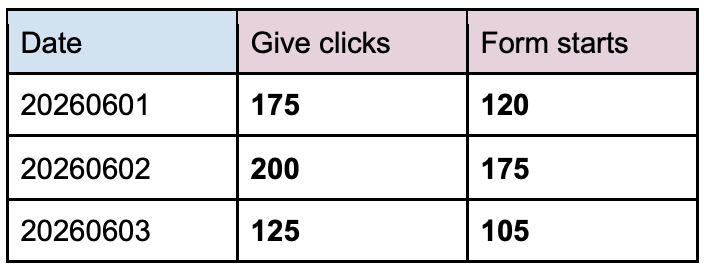
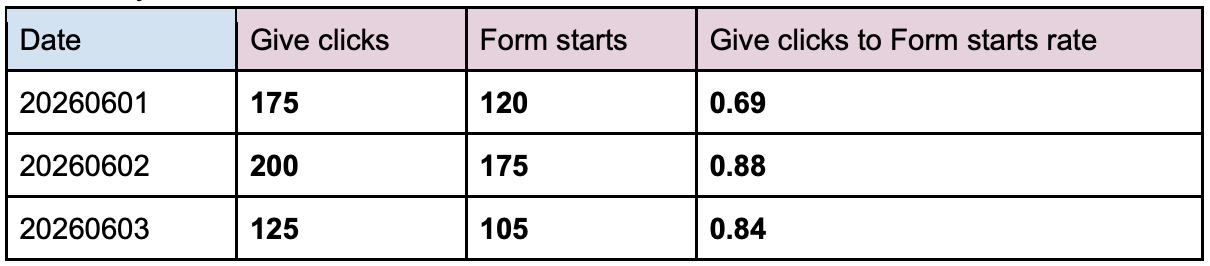
As it is, if you export the data to a spreadsheet, it will be easier for you to add more fields such as the completion rate, even over a longer period of time. For example, in the GA report, you can add the Date dimension:
But we can do more. In GA, you can make use of another feature called calculated metrics, which allows you to create a new metric based on a formula on other metrics (on the same row), just like how you use formulas in spreadsheets.
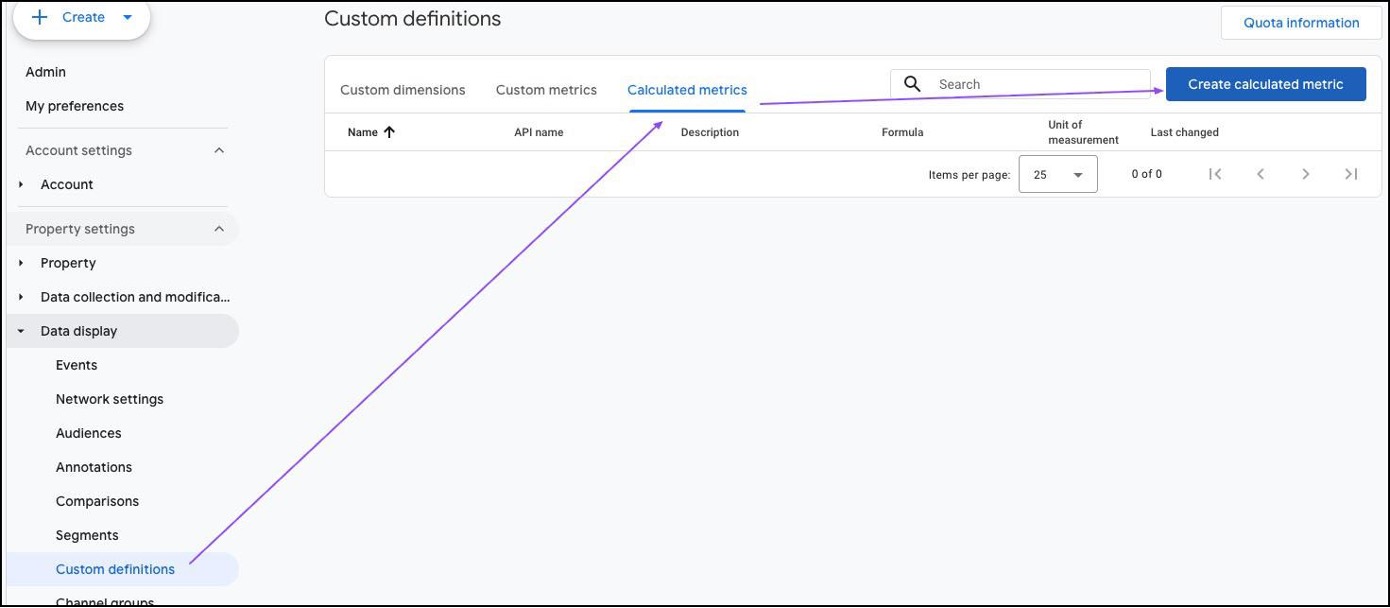
Follow this example to create a calculated metric:
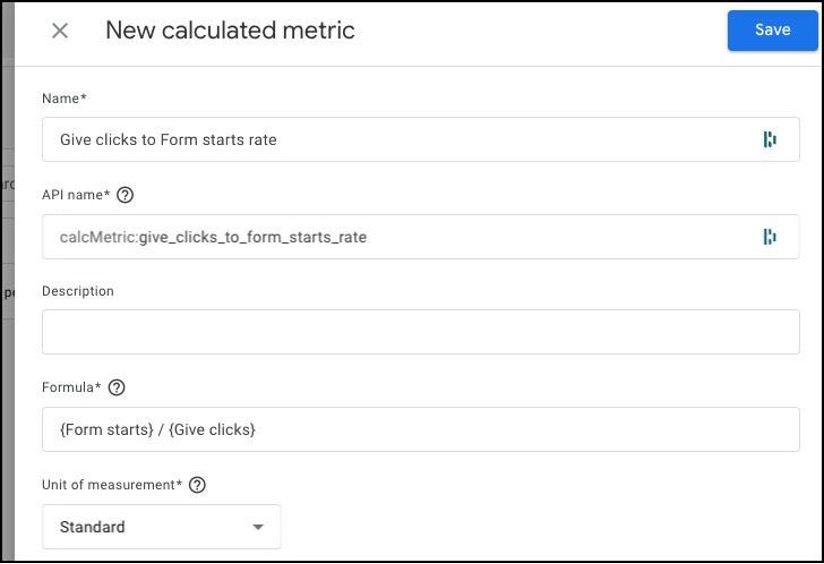
Then enter a formula like:
{{Form starts}} / {{Give clicks}}
Then when you add the calculated metrics in your GA report you will see something like:
Or if you break it down by the Date dimension:
As you can see, instead of having to do multiple steps, you do this kind of reports directly in GA, in just one step!
Many people have the misconception that you should only use custom metrics to measure real-world values such as monetary, quantity, time, distance. But as you can see, recording a value of 1 can be incredible useful for your reporting.You may not realize this at first, but GA has a lot of built-in metrics that are recording a value of
So the next time you record a GA event, ask yourself: Will there be a scenario where I need a dedicated custom metric for this event (or event+parameters combo) so that I can get the event count easily without having to filter data? Do that and you will help yourself and your team members greatly when doing GA reports.
A custom metric will only record data from the day that you implement it. So, what if you are in a situation where there were no custom metrics implemented in the past and you still want to improve your reporting? In this case, you use an alternative reporting method in Data Studio called data blend. Please read our article on Using Data Blends in Data Studio.