
Many people use Data Studio to visualize Google Analytics (GA) data. When connected to GA data sources, Data Studio works seamlessly without issues.
Now, you may think that other data visualization tools such as Power BI and Tableau will work the same way. However, they work in fundamentally different ways when connected to GA data sources. If you are not aware of the differences and you don't plan it properly, it can cause you a lot of issues (and headaches) trying to display the correct data.
In this article, we will explain the differences between the Data Studio and Power BI (and Tableau) when it comes to Google Analytics data.
Let's start from here. When you do reports in GA, for example:
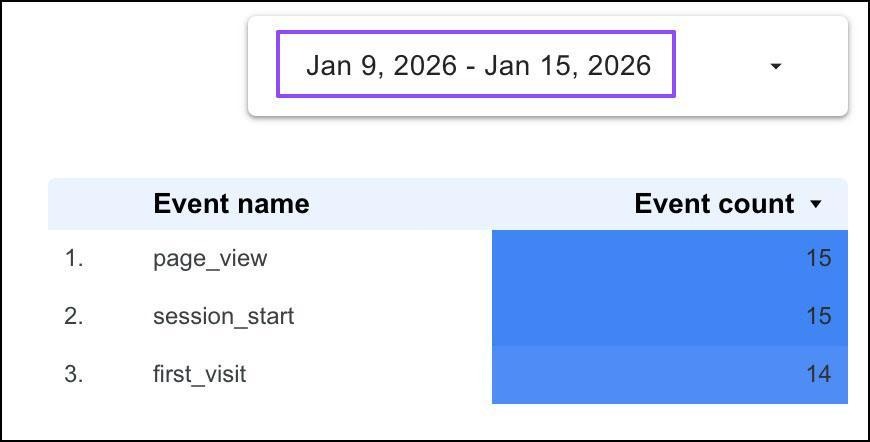
You will see results like this:
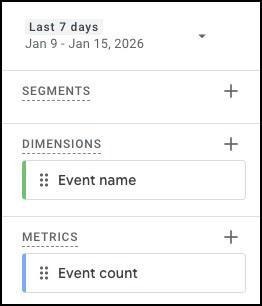
Now when you change the date range of the report:
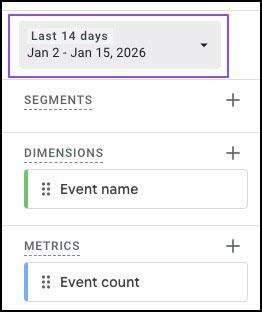
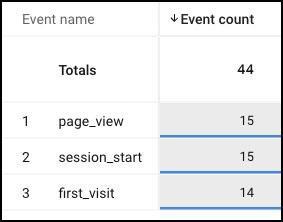
The results will be reflected immediately:
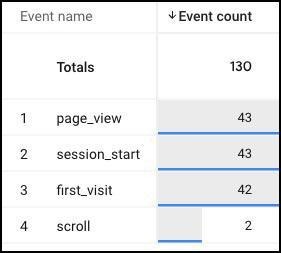
Key takeaway: GA will query and return the data in realtime.
Take note that, using the GA reporting interface, you are subjected to a few limitations, including:
When you use Data Studio to visualize GA data:
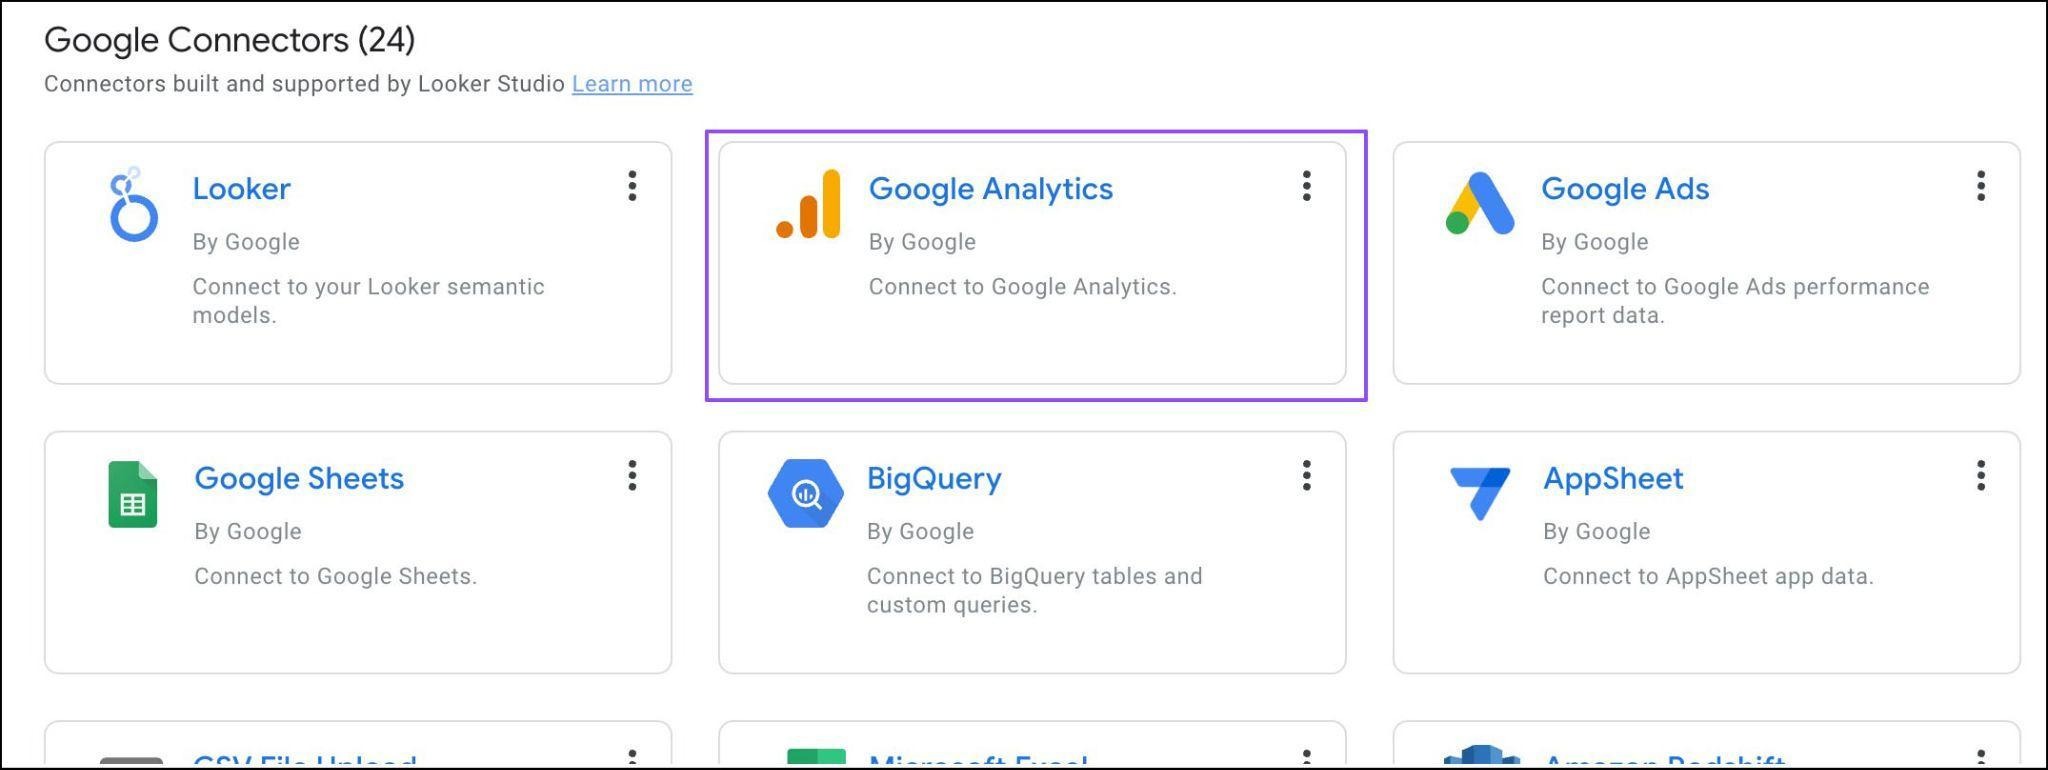
Data Studio actually connects to the GA Data API to retrieve the GA data. To visualize:
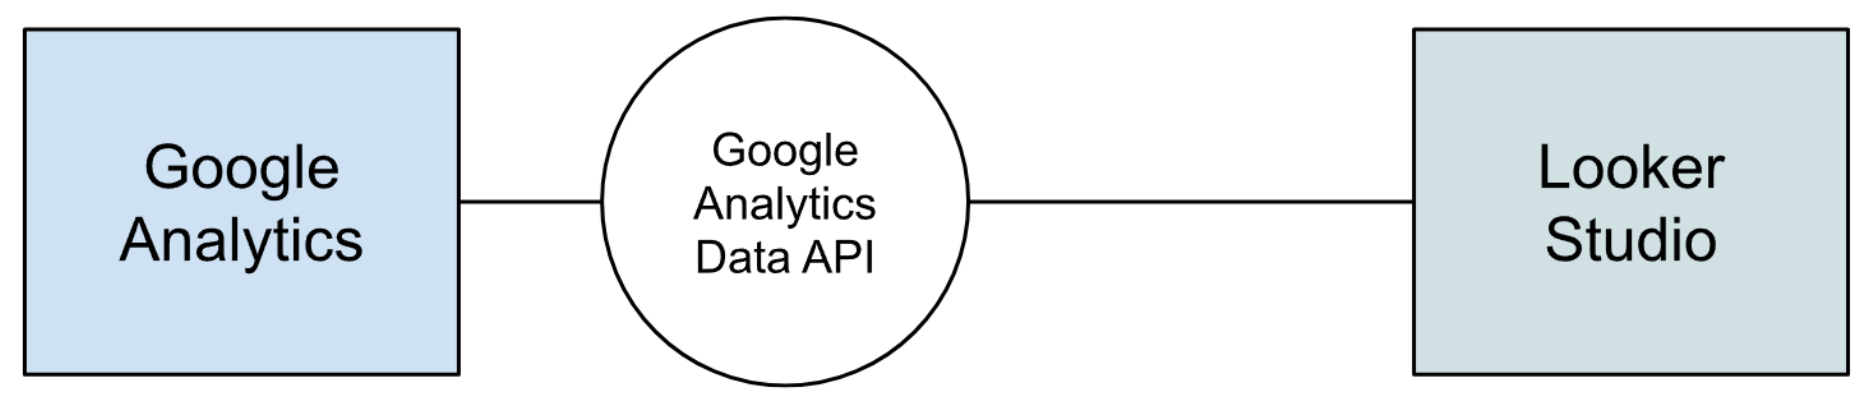
With Data Studio, you can change the date filters as you would in GA, and the data will be reflected immediately. For example:
Key takeaway: The data returned from the GA Data API will also be in realtime and it will have the exact same limitations as stated above. Not only that, the API itself is subjected to usage quotas. That means, if you have too many charts in your dashboard or have too many people changing the dashboard date ranges or filters, the dashboard may show request errors.
Having said that, in a typical dashboard usage, you should not face these issues.
Here we will explain the key differences when you choose to use Power BI to visualize GA data. The same principle should apply to Tableau.
When you use Power BI to connect to GA, it is also using the GA Data API. However, it is important to know that Power BI has its own intermediary database storage:
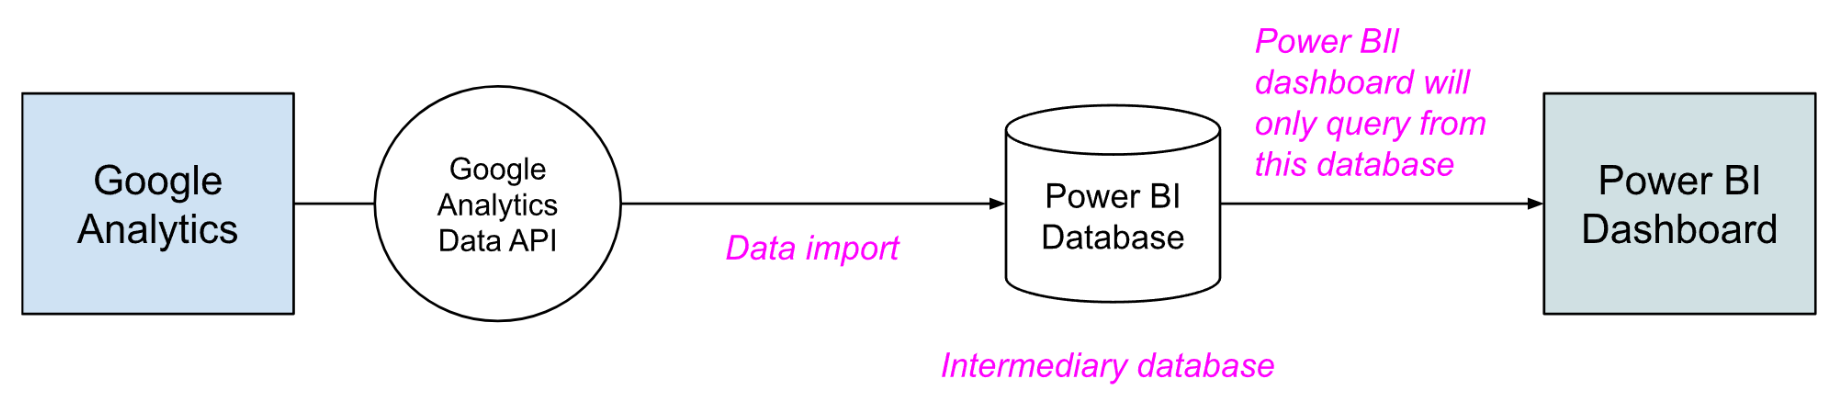
To get this to work, it's a two-step process:
Which means, there is no such thing as a "direct query" from GA API like you have with Data Studio.
Understanding this mechanism, you can start to recognize some challenges when using Power BI with GA data. Here we will share with you some major ones that we faced from our experience.
For future data, you can set up Power BI to do the import daily.
For past data, however, if it consists of a long date range (eg. years of data) and if you have many different charts querying different sets of data, you may face:
In order to import the past data fully, you would need to set up incremental import eg. monthly, weekly, or even daily import. And this process could take a long time to complete.
On top of that, if you make changes to the Power BI dashboard which requires data that was not imported before, you would have to repeat the process.
Let's use an example. Let's say I visit a website on two separate occasions using the same browser, to visualize the data recorded:
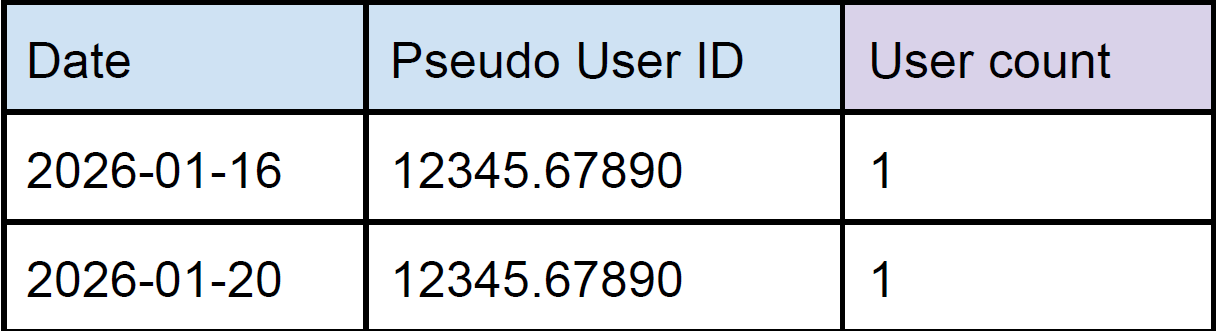
When you query the User count with a date range of 1st to 31st Jan, since Data Studio can do direct query, GA Data API will be able to determine that the two entries are the same user and it will return the correct metric:
In Power BI, however, the data has been imported in segments (eg. daily). Thus, when you query the User count with a date range of 1st to 31st Jan, it cannot (by default) determine the two entries are the same user and will return the accumulated metric which is inaccurate:
Now, you may think to use the Pseudo User ID field to do the deduplication. However, this not only introduces extra data transformation steps in Power BI, it can worsen the accuracy because of the cardinality issue as mentioned above.
What it means is that, if there are many users visiting the website on the 20th Jan, the data will consist of many, many rows. It which case, when importing the data, the GA Data API may return the condensed data like this:
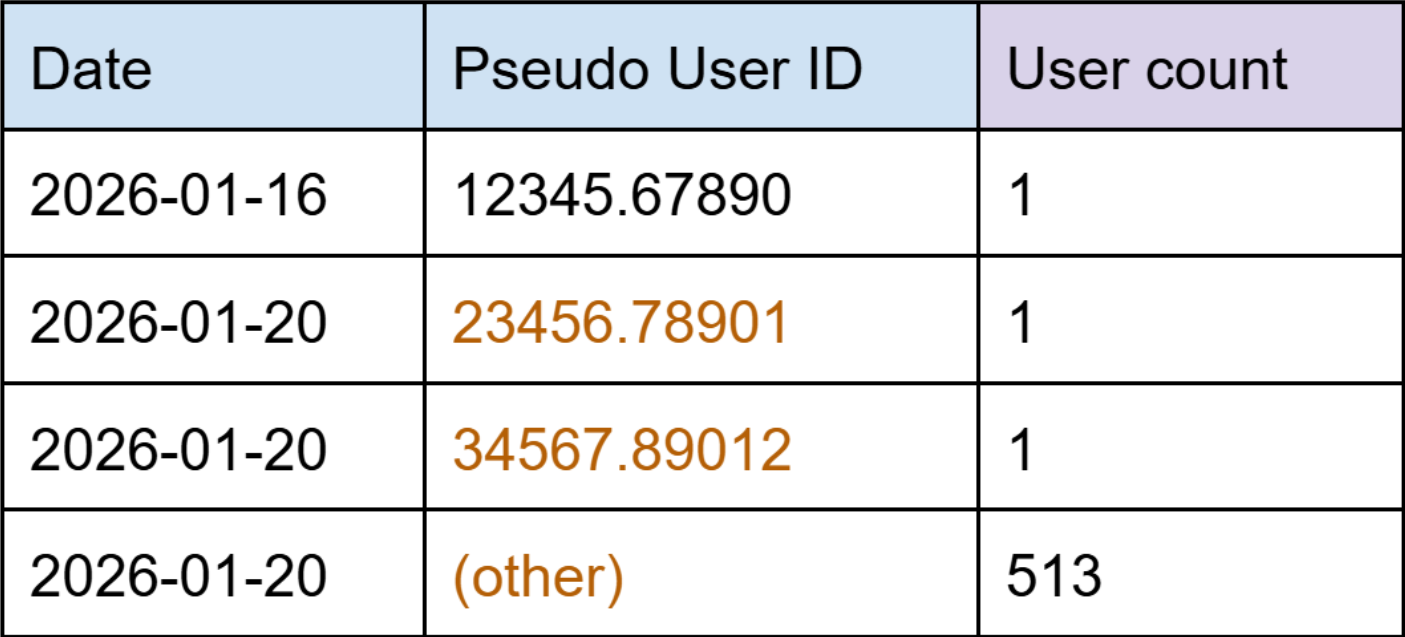
Which will limit your ability to do deduplication based on the Pseudo User ID. And that is also why the practice of recording the user IDs to a custom dimension is not recommended.
These challenges can be difficult to overcome, especially for #2 - getting the accurate User count. If you must have the User count info on your dashboards, here are two methods you can try:
You can design your dashboards deliberately to cater to the limitations. For example, instead of allowing dashboard users the free reign to select whatever date ranges they want, you might want to consider fixing the date ranges, eg.
Then configure your data import pipelines to cater to this method.
However, this is not without some cons:
In GA, you can enable BigQuery export, which exports GA raw data to BigQuery tables daily. BigQuery is a data warehouse that allows you to use SQL commands to query data. This allows you to query practically whatever data you want without the GA Data API limitations.
In Power BI, instead of connecting to Google Analytics, you can connect directly to BigQuery:
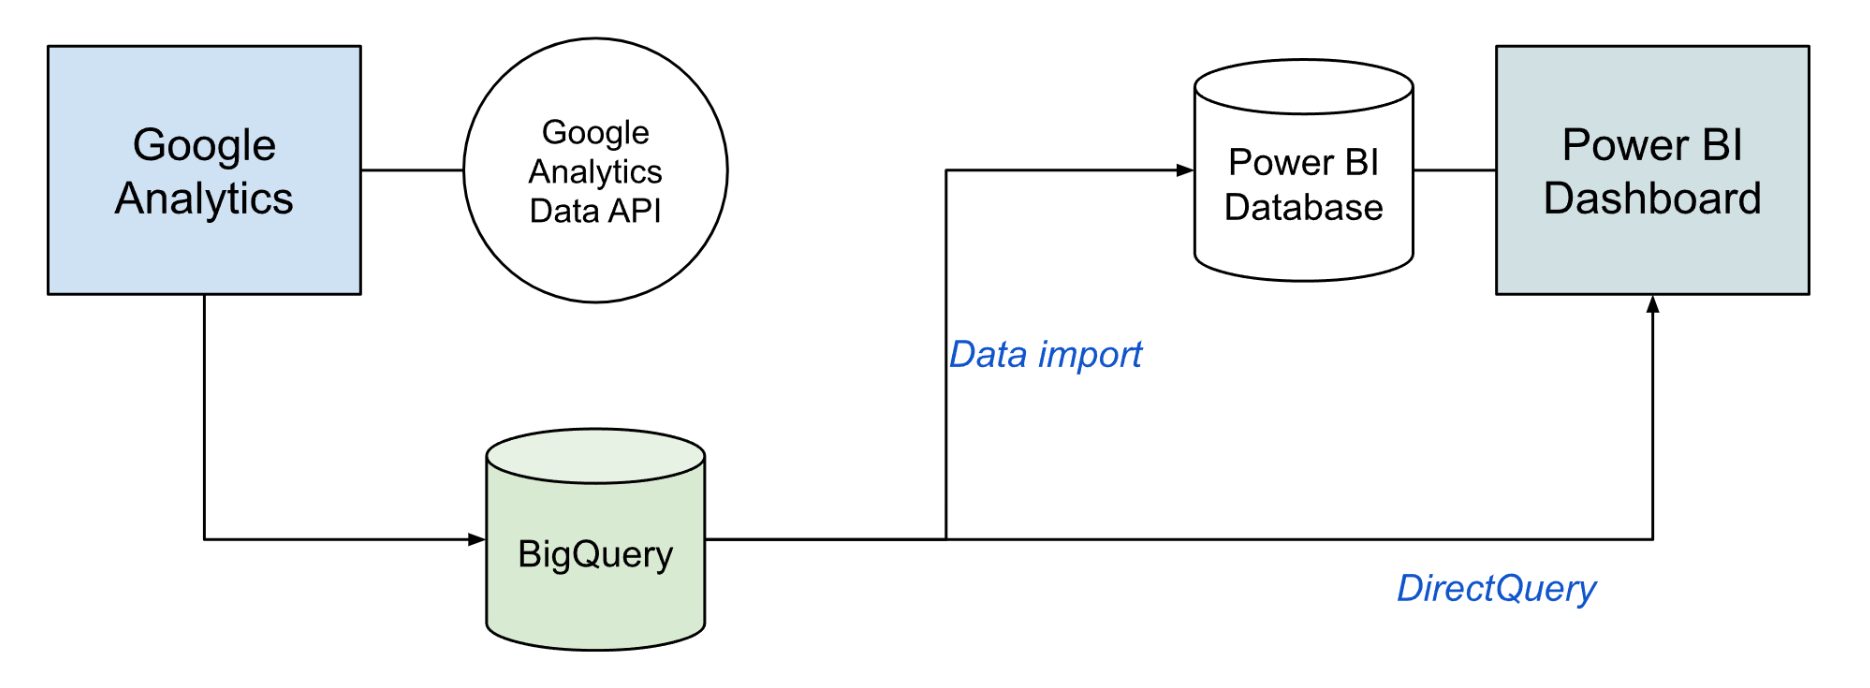
And when you do so, you can choose the data query methods:
If you want to visualize Google Analytics data, Data Studio is generally preferred due to its tight integration with the GA Data API. This is understandable as they are from the same company - Google.
This is certainly not to say that Data Studio is always better. Every requirement and situation is unique, you need to pick the right tool for the job. For example, your company could already be in the Microsoft Power Platform ecosystem and every staff is encouraged to use / can only access Power BI.
Also, each product has its own pros and cons. My Colleague JAIN Vibhor has written an excellent article, showcasing the powerful features of Power BI which Data Studio lacks:
https://ayudante.jp/column/2025-12-03/13-00/

%20on%20Stape%20-%20cover%20image.jpeg)