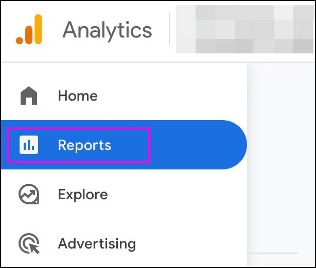
In Google Analytics (GA), you have been able to customize the reports in the interface:
Also known as Standard Reports.
If you are an Administrator or Editor of the GA property, you can customize the Collections, Topics, Overview Reports, and Detail Reports to best suit your users' needs. For example:
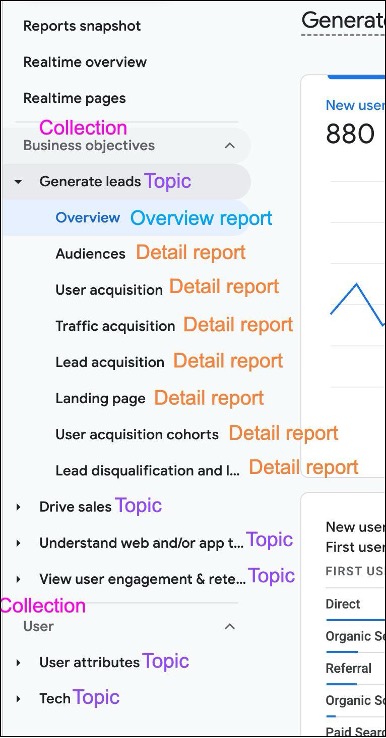
Some examples below.
Limited number of templates and the dimensions are metrics are fixed:
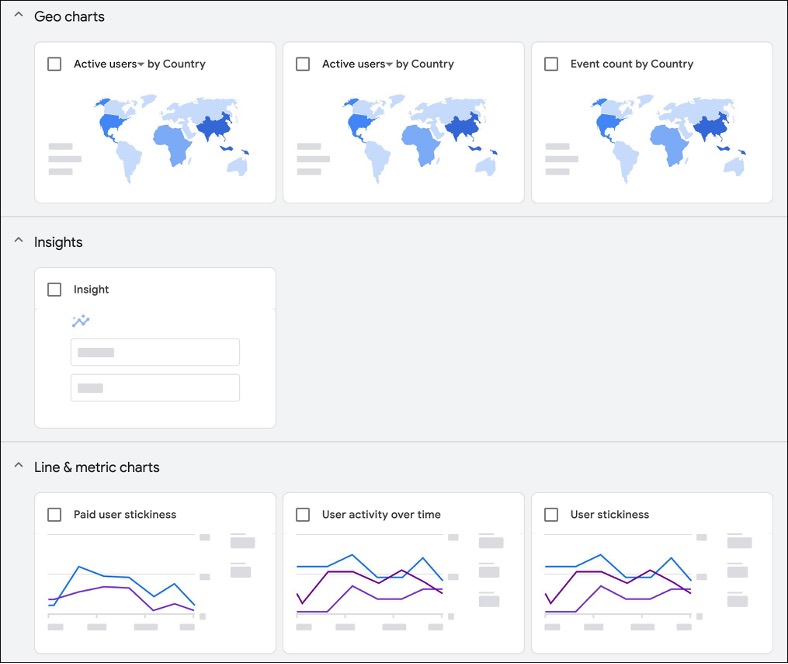
Fixed layout with limited number of charts displayed:
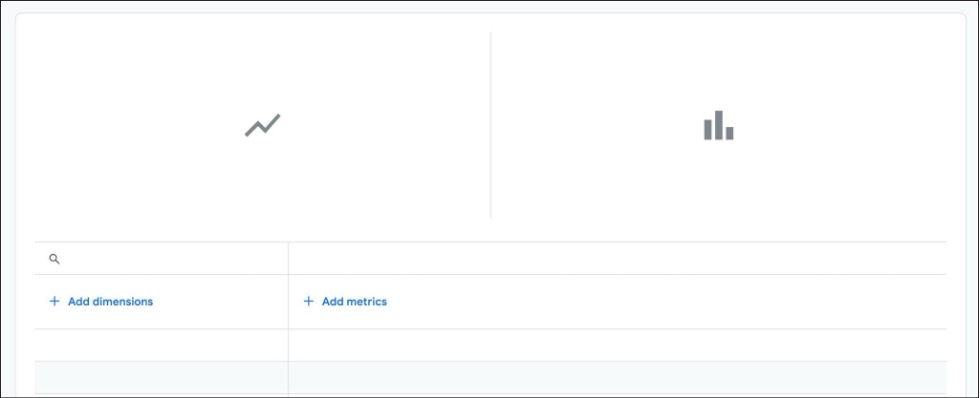
Can only see one dimension at a time:
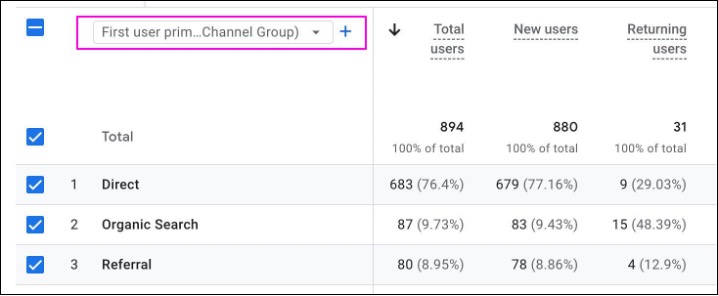
Also known as Explorations.
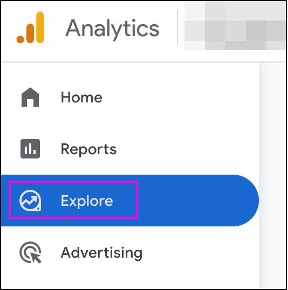
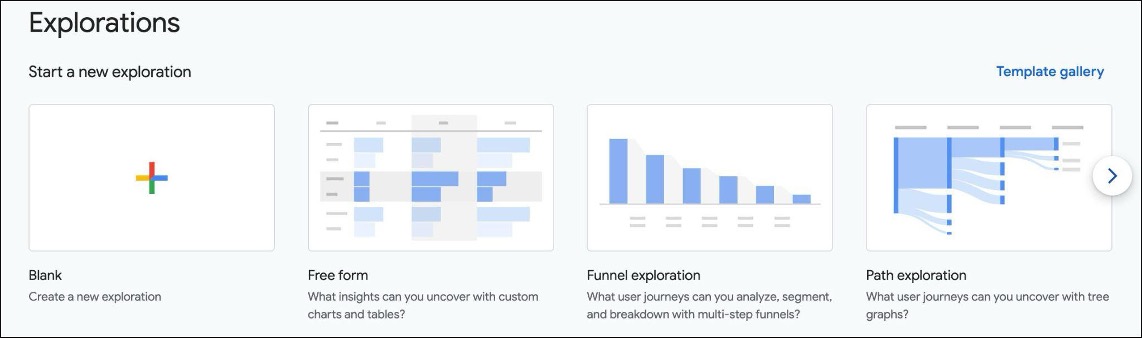
If you want to customize your own reports, you can create Explore reports where you get more flexibility to choose the chart types, dimensions, metrics, and filters. However, there are still some limitations:
Also, Explore reports are personal reports, which are not unified to all GA users. This creates problems such as isolated reports with different people reporting on the same thing differently, perhaps even incorrectly.
To close the gap, Google has just launched a new Dashboard report type to the Standard Reports, so now we have:
In this article, we will explain how to create dashboards in GA to give your users more useful insights, better user experience, and more incentive to stay within GA interface, without having to use a different dashboard platform.
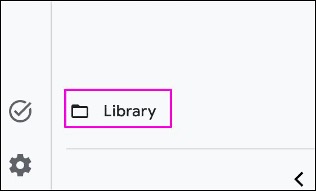
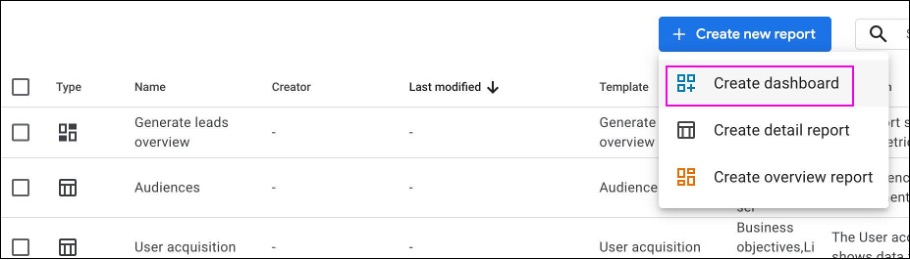
If you have used Data Studio before, you will find the interface familiar. You can think of GA Dashboard as the lite version of Data Studio.
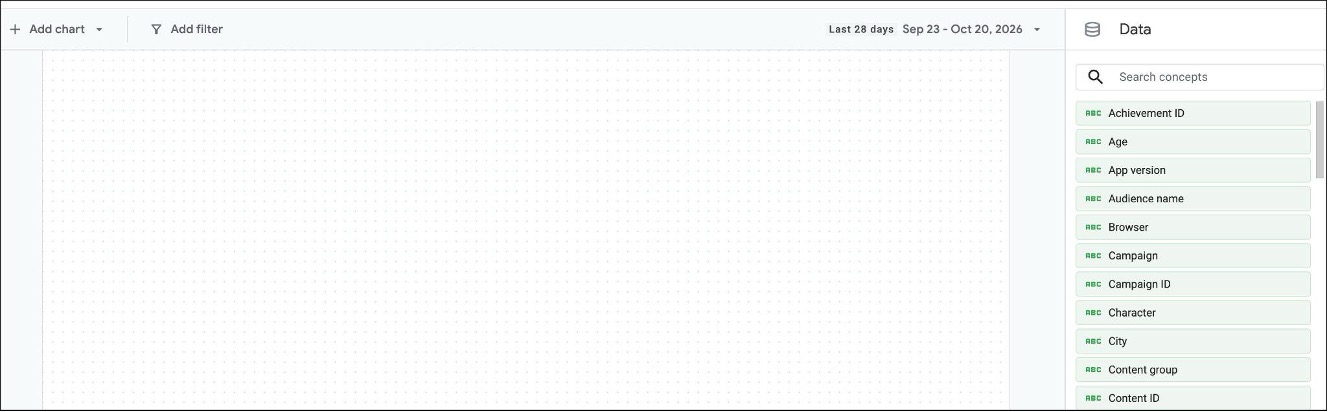
Left side is the report canvas where you add charts, and right side is the dimensions and metrics picker, also known as Data or Concepts:
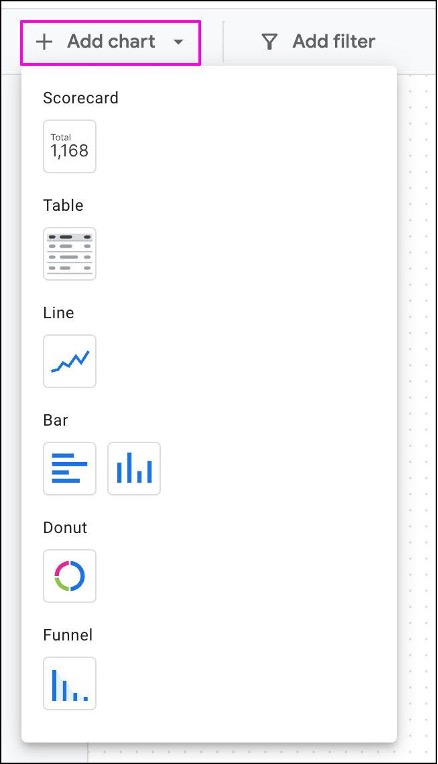
When you add a chart:
But you can change them according to your requirements.
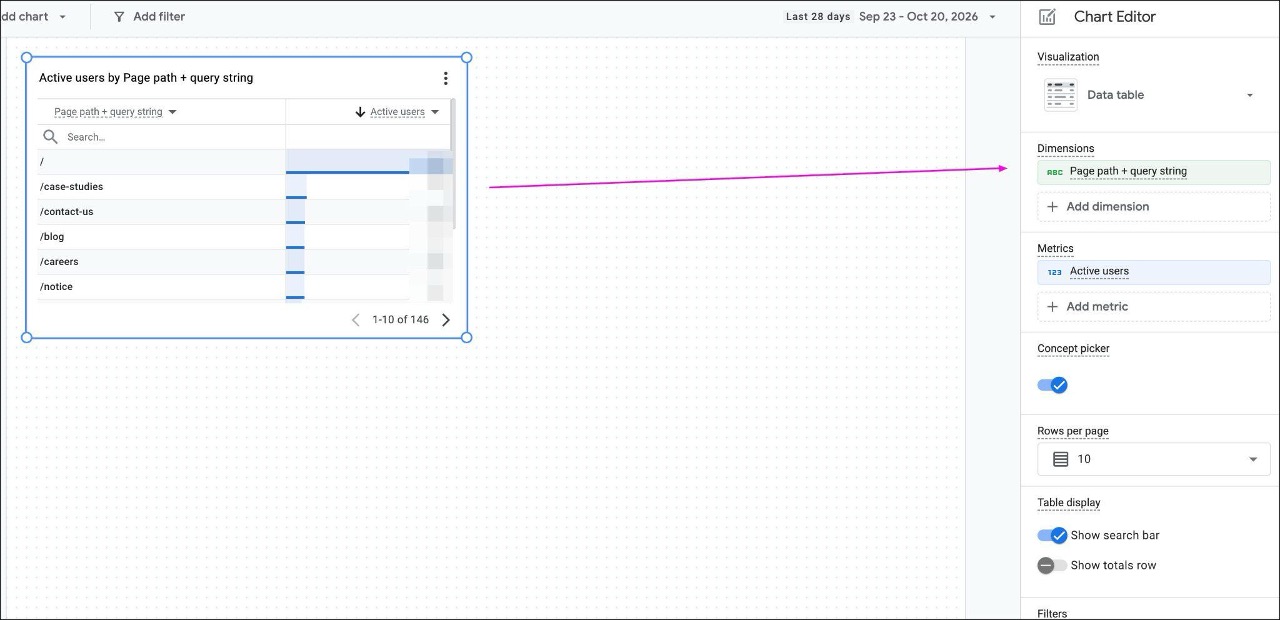
Click on a chart and you will see the right side change to Chart Editor, allowing you to add or change the dimensions and metrics:
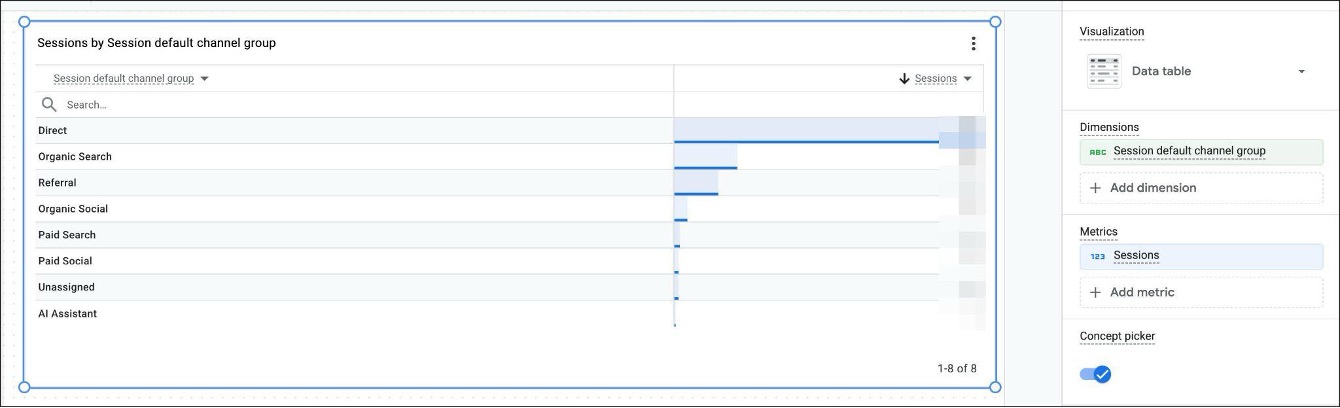
For example, we can change the example chart to show the traffic acquisition, and we can resize and reposition the chart as we see fit:
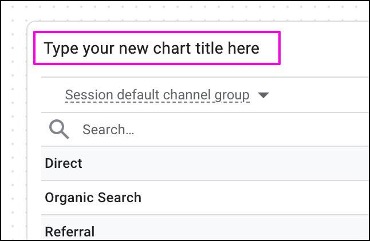
To change the chart title, simply click on the title and type in a new title:
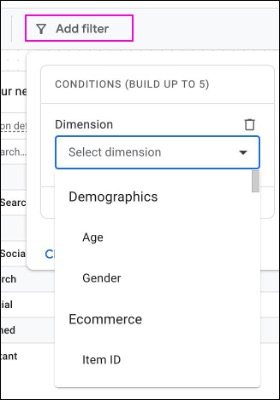
To add a global dimension filters that apply to all charts in your canvas, click Add filter on the main menu:
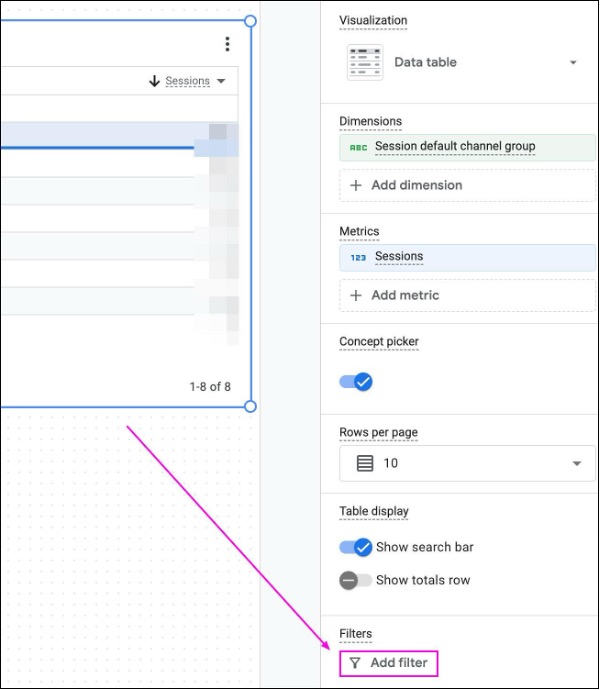
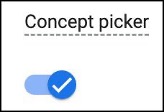
Allows GA users to change the dimensions and metrics on-the-fly to suit their needs. This feature can be useful in some self-service use cases:
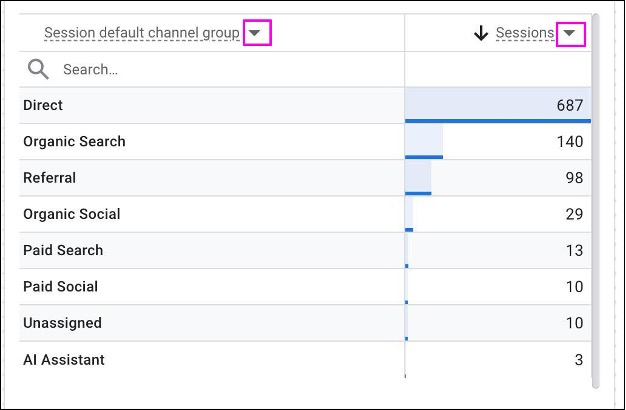
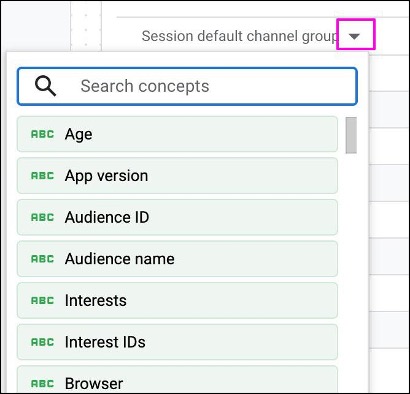
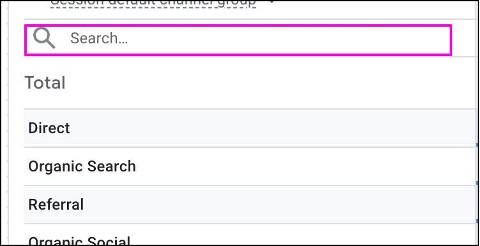
Allows users to search for and filter to specific dimension values:
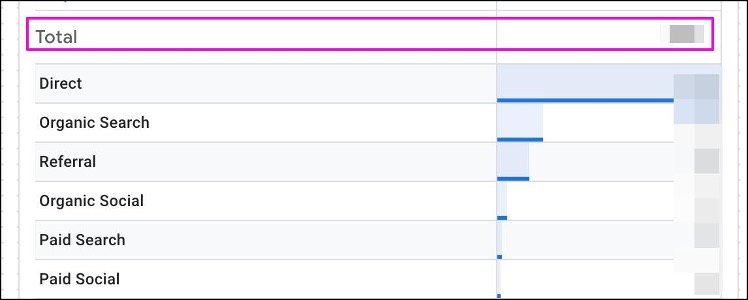
To show the sum of metric values:
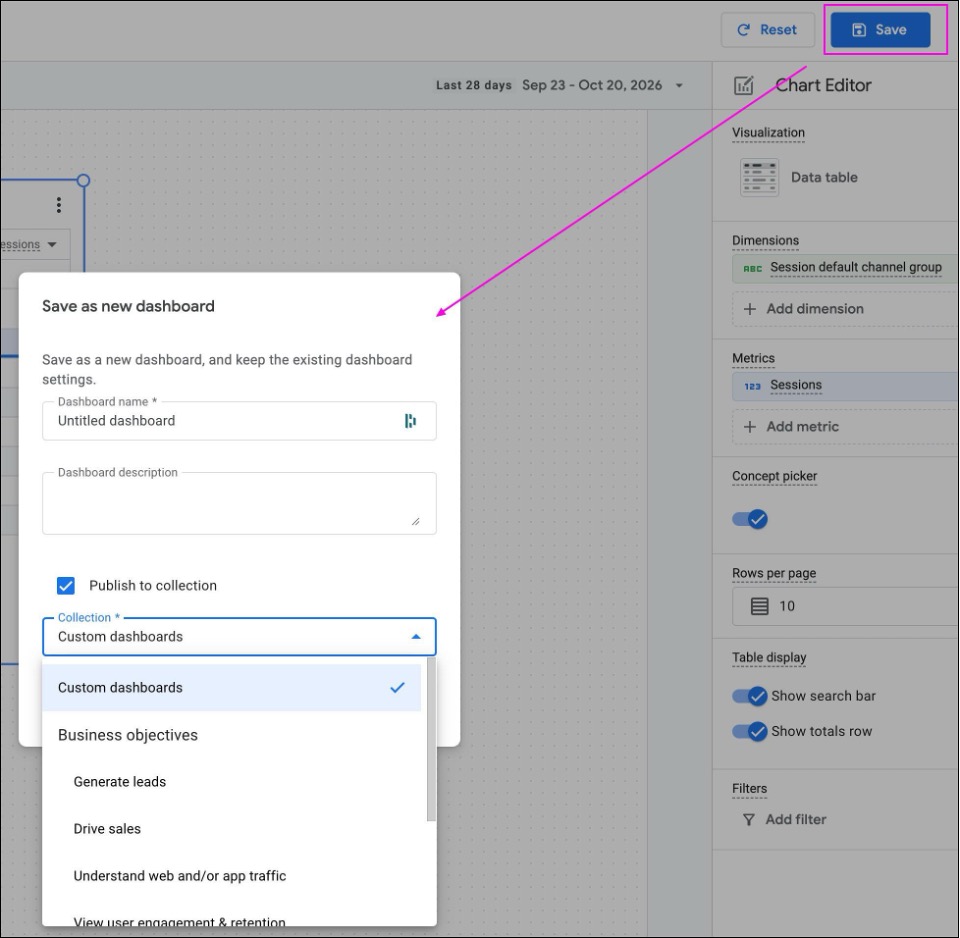
When you have created all the charts on your canvas, you can publish your dashboard so that GA users can access it.
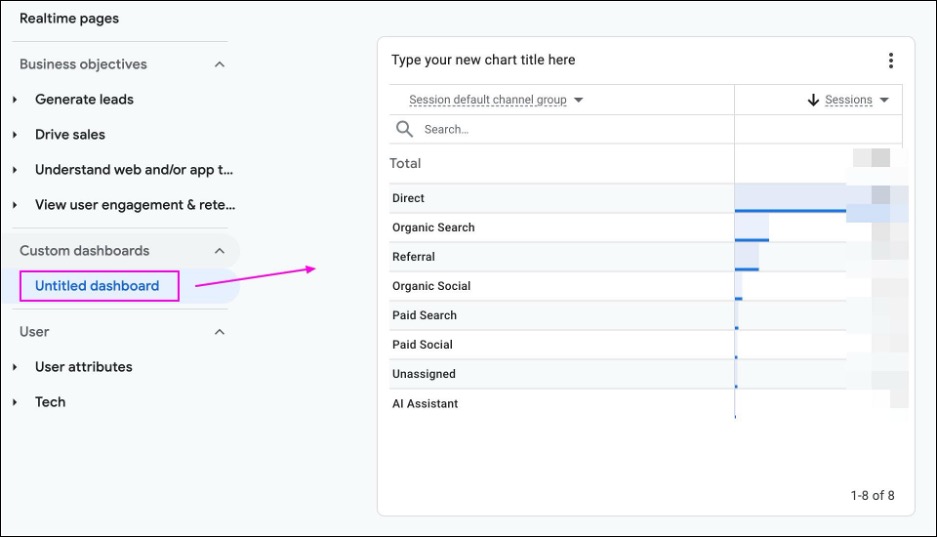
Once published, users will find the dashboard in the selected Collection:
Dashboard is a very welcome addition to GA. Although it has limitations (Data Studio remains the more powerful but more complex option), it should be able to meet the majority of your GA users' needs. When Overview Reports, Detail Reports, and Dashboards are configured properly on a GA property, your users will be able to self serve and get the insights they need, without having to create their own isolated Explore reports or jump to a different platform entirely.